1. Introduction
I volunteered at Kalø Økologisk Landbrugsskole, an organic agricultural college. I worked on the farm for a year. I was mainly responsible for the farm shop. This is where we sell the vegetables (and other items) we produce on the farm to consumers.
2. Personal project
For my personal project, I made a Google Sheet to keep track of what we sell in the farm shop.
Before I made the Sheet, I had already improved the way we kept track of what we sold. I will chronologically summarise the impovements I made.
2.1. Original method
Originally, we had a notebook. In that notebook, we had to write the list of vegetables on the right. On the left, we had to write “+ x” when we added any vegetables in the shop and “- x” when we took out any vegetables. For example, when we added an eggplant in the shop, we had to write “eggplant” on the right and “+1” on the left. If later that day we added another eggplant, we had to write “+1” again. Rows like “+1+2+6+1-2” were not uncommon. This way of noting was time consuming and confusing.
2.2. WSH-method: notebook
A while after having been responsible for the farm shop, I thought of a more efficient method of keeping track of what we sold.
This method is shown in the photograph below. From here on I shall refer to this method as the WSH-method.
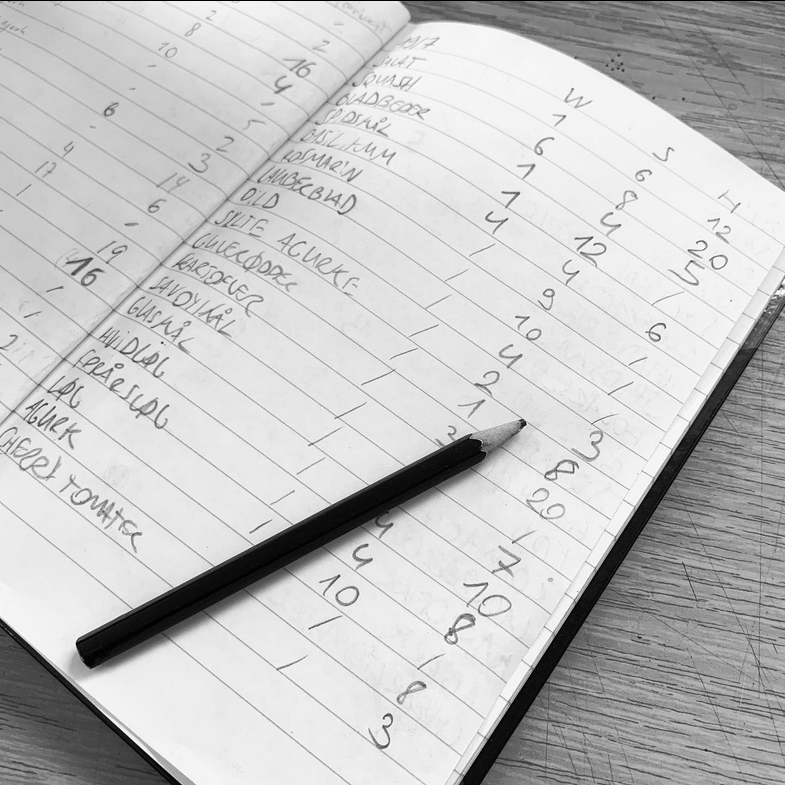
WSH stands for Waste, Stock, Harvest:
- Waste: First thing to do is checking what is no longer good. If something is thrown out, it is written under Waste.
- Stock: After throwing out the bad stuff, all the good stuff that is left must be counted. This is written under Stock.
- Harvest: Today’s harvest is written here.
This way of noting was less time consuming, as we would only have to count and write twice a day. It was also clearer.
2.3. WSH-method: Google Sheet
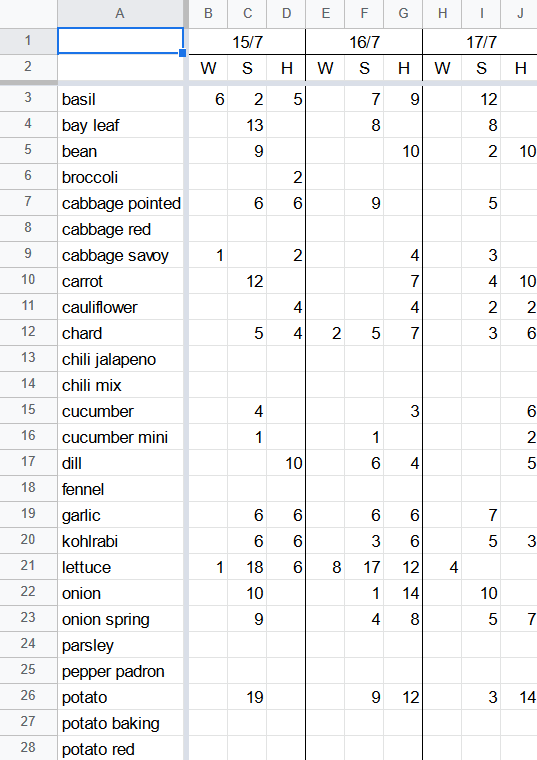
After having used the WSH-method for a short while, my colleagues and I decided that it would be more productive if we would use a Google Sheet instead of a physical notebook. This way, we would not have to write down the entire list of vegetables each day and it would enable us to make calculations, like revenue.
In the screenshot below, you can see the WSH-method in Google Sheet format:
2.4. Further development
My plan was to develop my personal project further. Using the WSH Google Sheet, I wanted to calculate figures like revenue and profit. These figures would have been useful to determine where we could improve our operations. For example: which crops are the most profitable, how much of what we seed do we sell, etc.
The screenshot below shows the figures which I had intended to calculate:
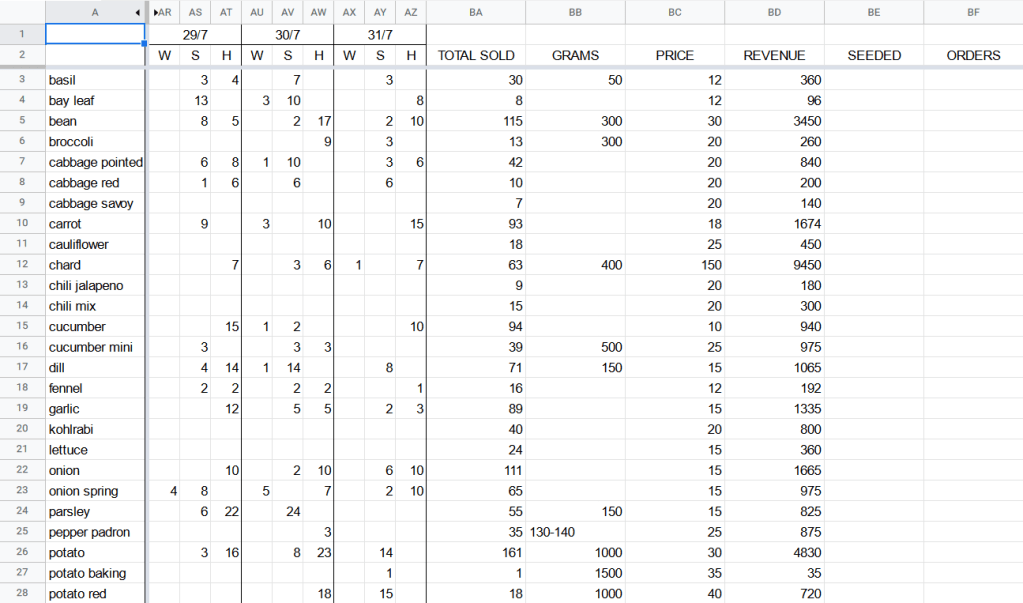
However, my project ended sooner than expected. So unfortunately, I could not make the calculations.
3. Conclusion
ESC taught me important lessons that I never thought I’d learn. I’ve become more down-to-earth and my sense of self-efficacy has grown. I am grateful for that.
If you are considering to become a volunteer, do not hesitate to get in touch with me to learn more about ESC, AFS or Kalø Økologisk Landbrugsskole:
- Instagram: @ivanabrike
- Email: ivanabrike@live.be
